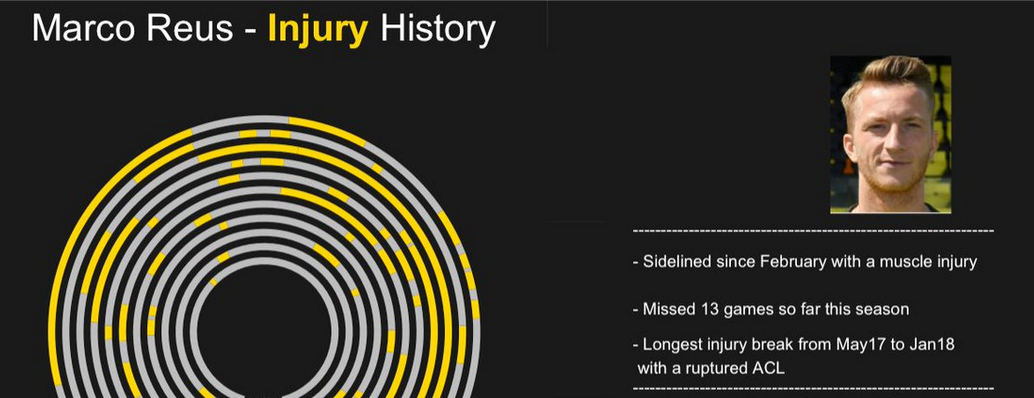
Injury Polar Plots
Injury data has been a bit of a guilty pleasure for me recently. When browsing through some of the data from Transfermarkt I looked into different ways of visualizing it. Specifically I was focused on highlighting injury lengths and their distribution over a player’s career. Screenshot from transfermarkt.com This resulted in the below viz for Marco Reus which is inspired by how I view the (European) football calendar: running counter-clockwise and with the summer break at 6 o’clock.
Quantifying Injury Rates
Being a Bayern Munich supporter, injuries have been a big part of past campaigns. During most of the past season (2017/2018) Manuel Neuer was injured with a broken foot. For the second match against Real Madrid in the Champions League semi finals the team had to additionally compensate the injuries of Jérôme Boateng, Arturo Vidal, Kingsley Coman and Arjen Robben. While Pep Guardiola was still coach at Bayern his dispute with the long-serving team doctor Mueller-Wohlfahrt culminated into him resigning after 38 years with the team (Mueller-Wohlfahrt was later reinstated in 2017).