Combining D3 and R for a Messi Pass Transition Heatmap
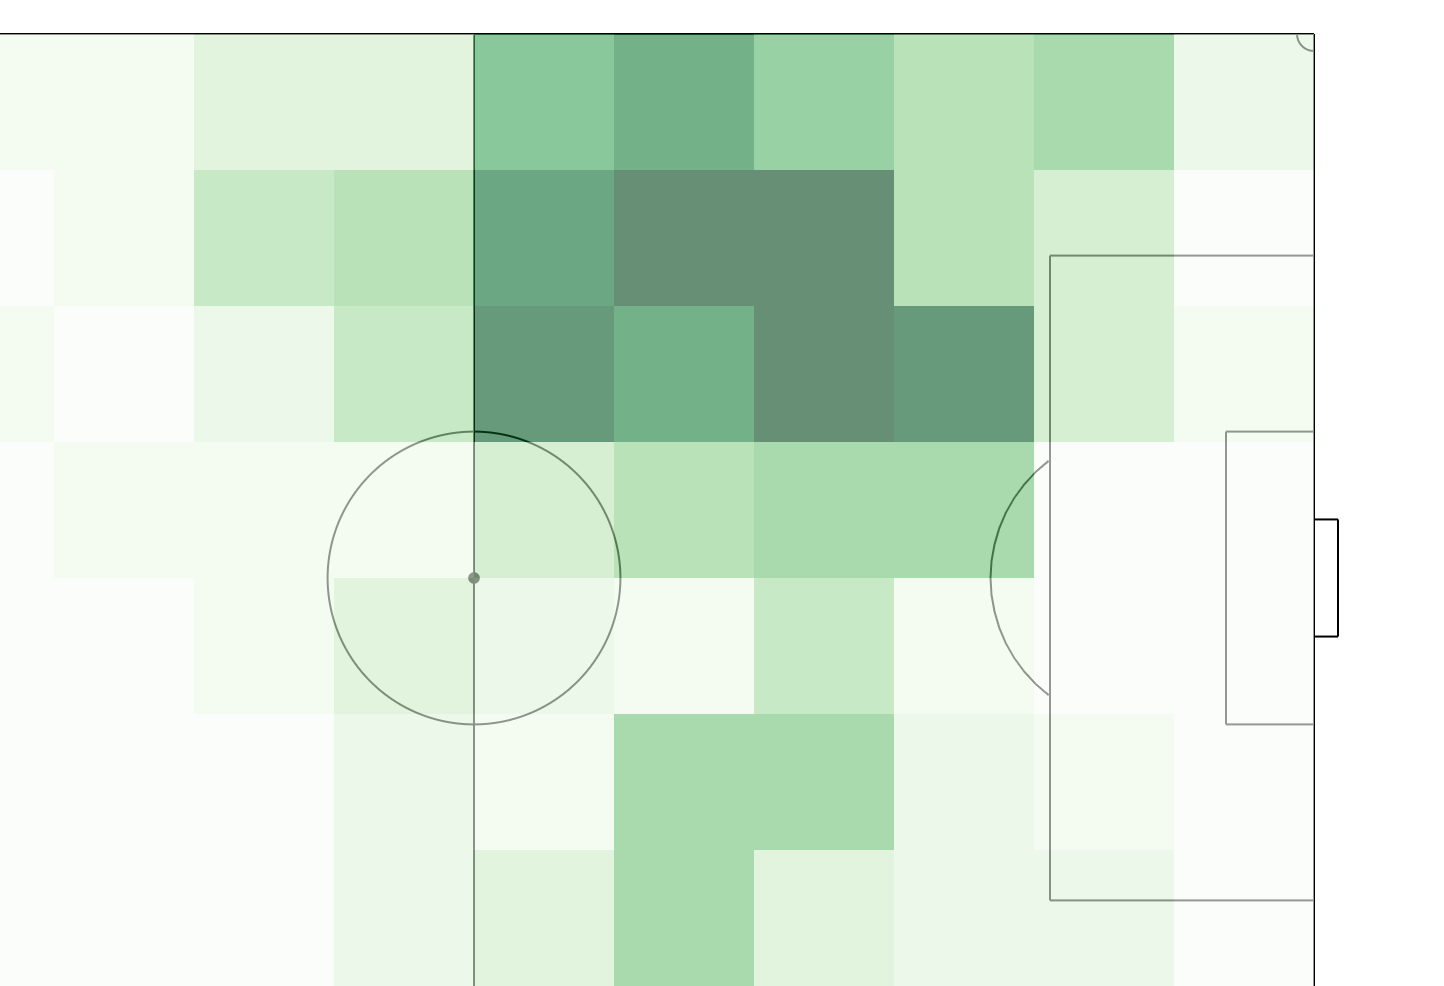
In this post I want to show off a nice feature of R that let’s you combine d3 and R workflows flawlessly to generate powerful visualizations. In this crossover of languages, R will take the role of data loading and manipulation while d3 focuses on producing the visualization. Below shows step-by-step how to generate the following pass transition heatmap based on free StatsBomb event data.