Combining D3 and R for a Messi Pass Transition Heatmap
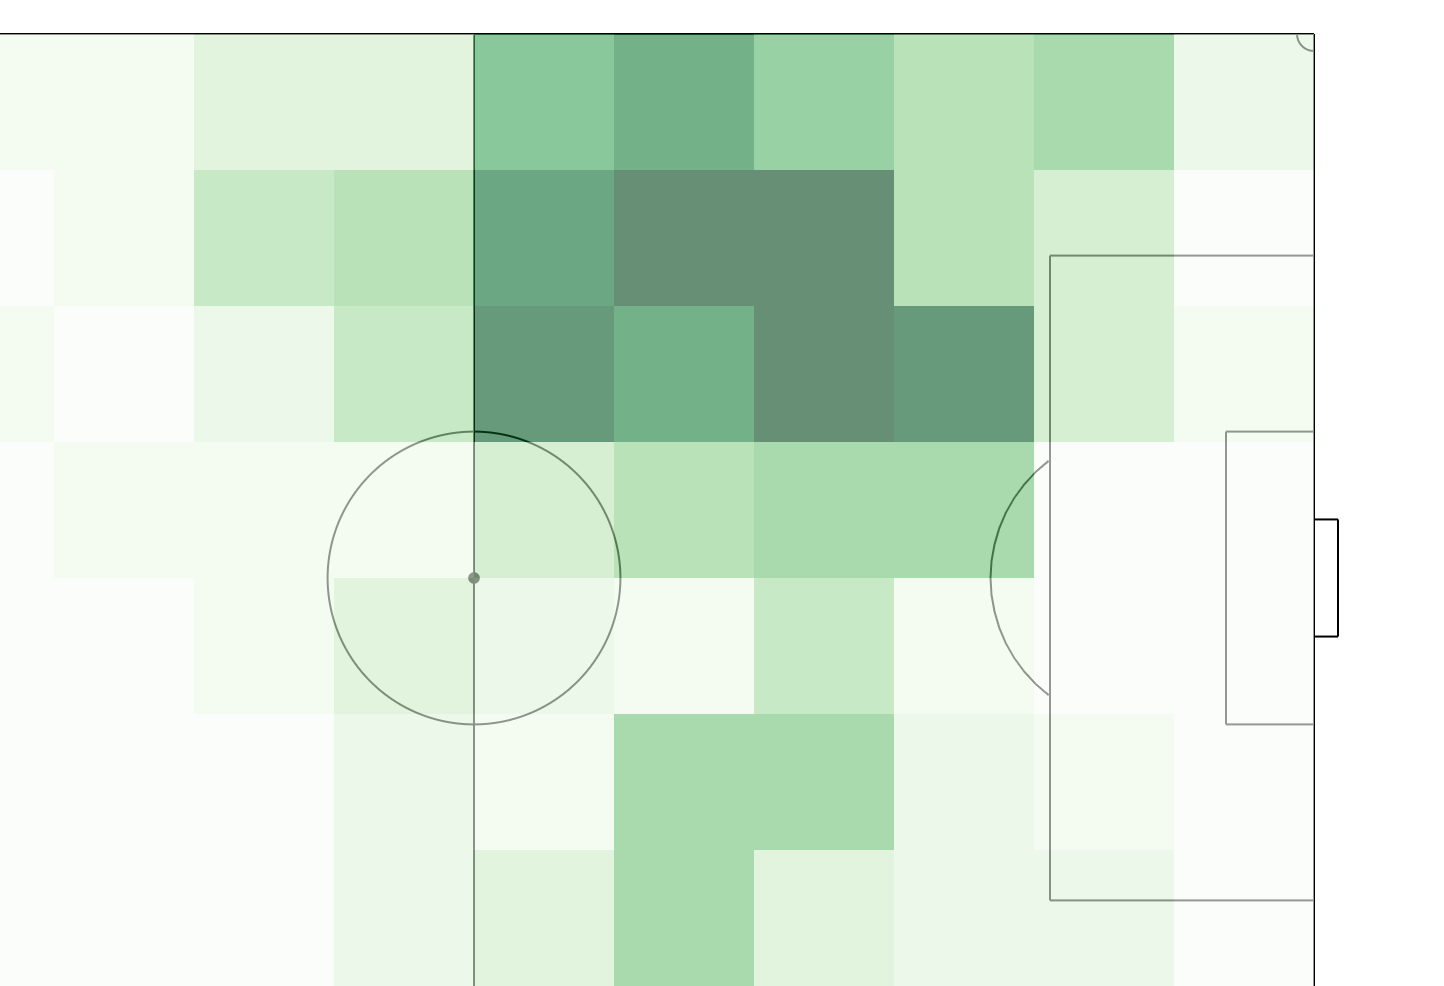
In this post I want to show off a nice feature of R that let’s you combine d3 and R workflows flawlessly to generate powerful visualizations. In this crossover of languages, R will take the role of data loading and manipulation while d3 focuses on producing the visualization. Below shows step-by-step how to generate the following pass transition heatmap based on free StatsBomb event data.
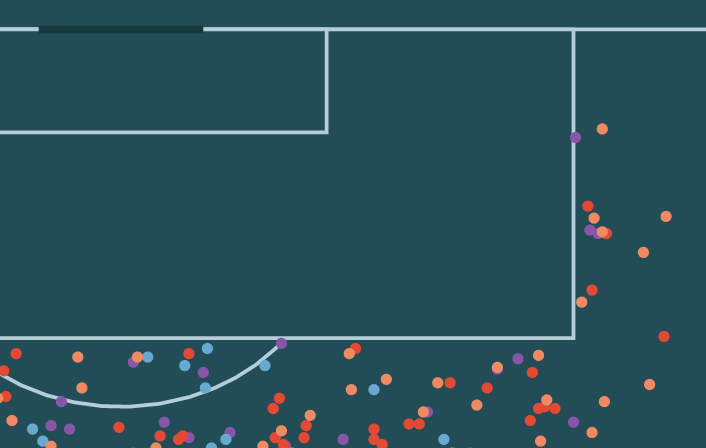
Lionel Messi - Free Kick Dashboard
I finally had some time to play around with the free Statsbomb data. I previously wanted to look into using the crosstalk package to link interactive charts and this data set which includes all of Messi’s La Liga free kicks gave me a good excuse. Launch Dashboard The initial idea was to link the location of free kicks to their goal impact (or their impact outside of the goal as long as they are not blocked).